
DowJones US30 Technical Analysis: The Dow Jones continues to trade in a strong long-term uptrend, as it remains above the major moving averages, which reinforces the strength of the uptrend. However, we have recently witnessed some temporary pullbacks that are affecting the uptrend.
Today’s Highs and Lows:
- High $41,265
- Low $41,128
- Current Trading Price $41,192
DowJones US30 Technical Analysis: Current Trend Analysis
General Trend: Despite the strong uptrend in the recent period, we notice a slight decline in the bullish momentum during the current trading session. The index is trading above the moving averages, reflecting the overall positive trend, but there are some signs of weakness in the bullish momentum.
On the Upside: If the index is able to maintain its position above the current support level and trade above the previous high at $41,265, the uptrend may continue. Any signals confirming continued buying power should be monitored to support buying opportunities.
Downside: If the current weakness continues and prices fall below the support level at $41,128, we may see a reversal in the trend to the downside. This requires confirmation from technical indicators and monitoring for any additional signals that reinforce the negative trend.
DowJones US30 Technical Analysis: Using Technical Indicators
Moving Averages:
- Current Situation: The Dow Jones is trading above the moving averages, indicating that the overall trend is still bullish. Any crossovers between the moving averages should be monitored to confirm that the upside strength is continuing or that there are signs of a reversal in the trend.
MACD Indicator:
- Current Situation: The MACD indicator is showing a positive trend, but it indicates a weakness in the strength of buying demand. This weakness could be an indication that the trend may turn negative.
- Signals: If the MACD indicator turns negative, there should be confirmation by the MACD line crossing the signal line or a decrease in the indicator values to support selling opportunities.
Future Recommendations:
- Buy Strategy: It is advisable to consider buying the index if it continues to trade above key support levels and shows signs of regaining bullish momentum, with technical indicators confirming renewed buying power.
- Sell Strategy: It is advisable to watch for potential trend shifts and if the MACD turns negative or the support levels at $41,128 are broken, selling opportunities can be considered. Make sure to follow any additional signals confirming the downtrend.
Best Trading Opportunities:
- Buying opportunities: May be available if the continuation of the uptrend is confirmed by breaking the resistance levels and buying power is confirmed by the MACD indicator.
- Selling opportunities: They are enhanced if the index declines below the support levels and strong negative signals appear from the MACD indicator and other technical indicators.
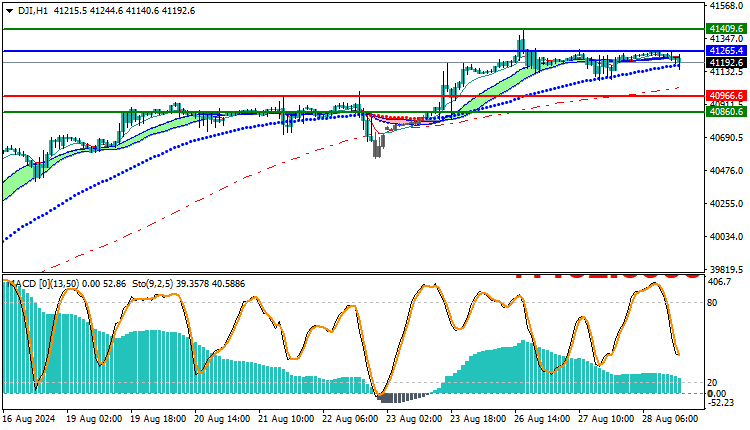
Trading strategies based on Buy/Sell levels
| US30 | In case of buying | in case of selling |
| Entry point | 41265 | 40966 |
| Target Point 1 (TP1) | First resistance: 41409 | First support: 40860 |
| Target Point 2 (TP2) | Second resistance: 41620 | Second support: 40780 |
| Stop Loss (SL) | 40966 | 41265 |
Currently, the Dow Jones is showing an upward trend but with a slight decline in the upward momentum. It is trading above the moving averages, but weak buying demand could lead to a potential trend reversal. It is essential to closely monitor market movements and evaluate technical indicator signals to determine the best trading strategies according to future reversals.


