
Dow Jones US30 Technical Analysis: The Dow Jones Index continues to maintain its upward trajectory during today’s trading, recording a high of $41,509 and a low of $41,300, while the current price is trading at $41,336. Despite some signs indicating weakness in the upward momentum, the overall trend remains bullish.
Dow Jones US30 Technical Analysis: Technical Analysis
- Moving Averages: The chart indicates that the Dow Jones Index is trading below some moving average indicators, reflecting a state of divergence between the current trading and the general trend. Although this signal may suggest pressure on prices, the upward trend is still prevailing.
- MACD Indicator: The MACD indicator is showing signs of weakness in the strength of the upward trend, as the fast line is heading downward near the slow line, indicating a possible slowdown in the rise or even a short-term correction.
US30 Dow Jones Technical Analysis: Financial Recommendations
- Buy: As the overall uptrend continues, it is recommended to hold long positions as long as prices remain above key support levels.
- Sell: Short-term selling positions may be considered if there are signs of further weakness in momentum or prices move below specific support levels.
Today’s Recommendation: As the overall uptrend continues, analysis recommends holding long positions, while paying attention to any signs of weakness from technical indicators. It is advisable to follow any changes in momentum or support levels that may affect trading decisions.
US30 Dow Jones Technical Analysis: Today’s Outlook
The Dow Jones is expected to remain under the influence of an uptrend, but we may see some volatility or correction in prices due to the weak momentum shown by the MACD indicator. Traders should follow the situation closely to take advantage of any potential trading opportunities.
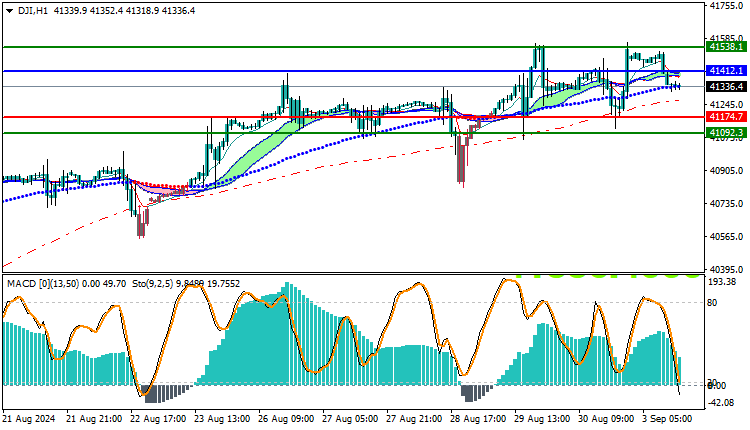
Trading strategies based on Buy/Sell levels
| US30 | In case of buying | in case of selling |
| Entry point | 41412 | 41174 |
| Target Point 1 (TP1) | First resistance: 41538 | First support: 41092 |
| Target Point 2 (TP2) | Second resistance: 41710 | Second support: 49450 |
| Stop Loss (SL) | 41174 | 41412 |
The Dow Jones remains bullish, despite signs of weakness in technical momentum. It is advisable to continue with the long strategy while closely monitoring changes in technical indicators and support levels. Stay informed to adapt your trading strategies in line with market changes.


