
Dow Jones US30 Technical Analysis: The Dow Jones is trading in a downward direction today, as it recorded its highest price so far at 44038 and its lowest price at 43850, and is currently trading at 43955. The technical analysis indicates that the downward pressures on the index continue, despite the weak negative momentum.
Dow Jones US30 Technical Analysis: General Market Trend
The index is trading below most of the moving average indicators, which reinforces the downward trend in the short term. This indicates that negative pressures are currently controlling the market, reflecting the continuation of the decline as long as prices remain below these averages.
Technical Indicators Analysis:
- Moving Averages:
Trading the index below the major moving averages reinforces expectations of continuing the downward trend. If prices continue to move below these averages, the index may face more negative pressures in the short term.
- MACD Indicator:
The MACD indicator is showing a weak negative trend, as it continues to support the downtrend with a sign of weak negative momentum. This sign could mean that the downtrend could be on its way to weakening or turning into a volatility phase if the negative pressure does not continue strongly.
Advanced Technical Analysis:
Despite the current downtrend, the weak negative momentum as shown by the MACD indicator could indicate that the downtrend could start to weaken soon. Therefore, prices should be monitored at key support and resistance levels to determine the possibility of a reversal or stabilization in prices.
Future Outlook:
If the indicator continues to trade below the moving averages with weak negative momentum in the MACD indicator.
the downtrend is expected to remain intact in the short term. However, if the weakness in the downward pressure continues, we could witness a period of volatility or even a possible trend reversal.
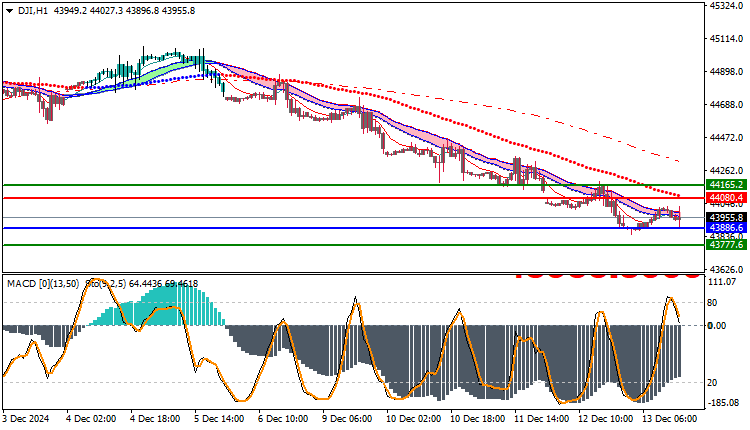
Trading strategies based on Buy/Sell levels
| US30 | In case of buying | in case of selling |
| Entry point | 44080 | 43886 |
| Target Point 1 (TP1) | First resistance: 44165 | First support: 43777 |
| Target Point 2 (TP2) | Second resistance: 44210 | Second support: 43610 |
| Stop Loss (SL) | 43886 | 44080 |
The Dow Jones is currently trading in a downtrend, with the trend confirmed by trading below the moving averages and supported by the MACD indicator which shows a weak negative trend. It is important to follow the key support levels and watch the price action closely to determine whether the downtrend will continue or if a reversal will occur in the market.


