
Dow Jones US30 Technical Analysis: The Dow Jones Industrial Average is trading in a downward trend today, as it recorded its highest trading price so far at 42752 and its lowest price at 42320, and is currently trading at 42411. This decline reflects the continued negative pressure on the index, with prices trading below the moving averages, which reinforces the downward trend at the present time.
Dow Jones US30 Technical Analysis: Technical Analysis
Moving Averages:
The index is currently trading below the major moving averages, indicating that the downward momentum has declined significantly, while this trading below the moving averages reinforces the negative outlook in the short term. This means that any upward attempts may face strong resistance at these averages.
MACD Indicator:
The MACD indicator indicates a negative trend, as it shows bearish crossovers that support the downward trend in the market. The weakness in the upward momentum reinforces the possibility of continued selling pressure on the index in the coming period.
Outlook:
Continued trading below the moving averages and negative signals from the MACD indicator reinforce expectations of a continuation of the downward trend for the index in the short term. The Dow Jones index is expected to remain under selling pressure, with the possibility of a decline towards lower support levels if trading continues below the moving averages.
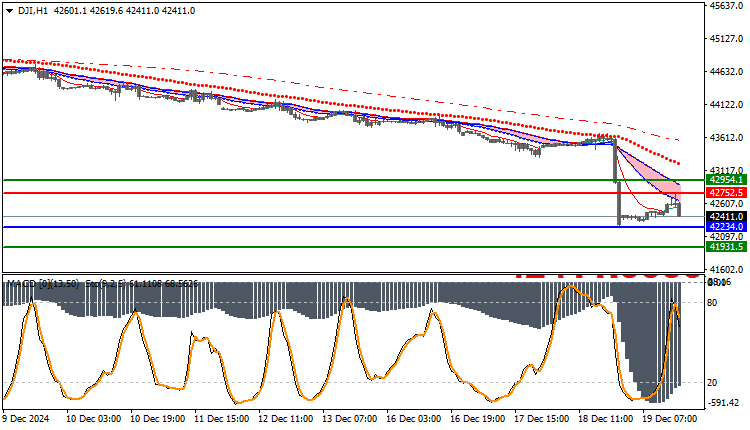
Trading strategies based on Buy/Sell levels
| US30 | In case of buying | in case of selling |
| Entry point | 42752 | 42234 |
| Target Point 1 (TP1) | First resistance: 42954 | First support: 41931 |
| Target Point 2 (TP2) | Second resistance: 43110 | Second support: 41840 |
| Stop Loss (SL) | 42234 | 42752 |
The Dow Jones is trading in a short-term downtrend, supported by trading below the moving averages and negative signals from the MACD. The selling momentum is likely to continue to affect the index, which could lead to a further decline towards lower support levels in the near future.


