
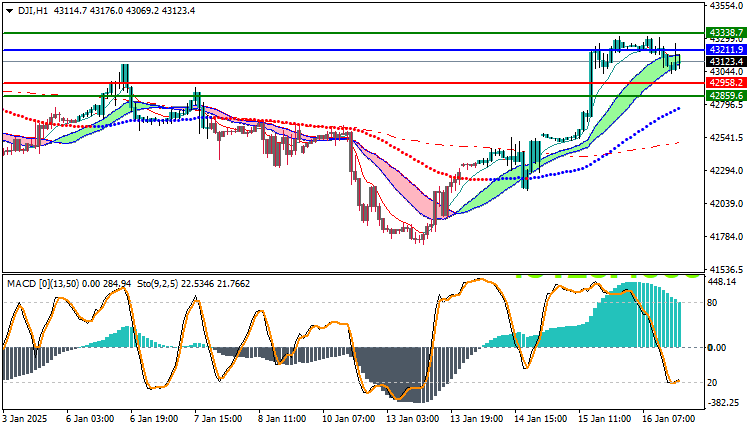
Dow Jones US30 Technical Analysis: The Dow Jones is trading in an uptrend today, with the index recording a high of 43312.2 and a low of 40317.3. Currently, it is trading at 43123.4. The price action indicates a strong upward momentum, reflecting an improvement in market sentiment and supporting the current uptrend.
Dow Jones US30 Technical Analysis: Price Analysis
The index is trading in an uptrend, with the price trading above key support levels reflecting bullish momentum. This reinforces expectations of a continued bullish trend in the near term. If the price continues to trade above 40317.3, the index is likely to continue its upward trend towards higher resistance levels such as 43312.2.
Technical Analysis
Moving Averages: Trading above key moving averages indicates that the uptrend is currently prevailing. The index is trading above simple moving averages, which supports the positive outlook for the bullish momentum. This signal supports the idea of continuing the bullish trend as long as the index remains in this area.
MACD Indicator Analysis: The MACD indicator is showing a positive trend, as it is moving in the positive zone, reflecting the bullish momentum in the market. This signal confirms the continuation of the purchasing power and supports the bullish trend of the index. As long as the MACD indicator remains in this zone, there is a chance for the bullish momentum to continue.
Future Market Outlook:
The Dow Jones index is expected to continue its bullish trend in the near term, given that the price is trading above the moving averages and the positive signal from the MACD indicator. If the index continues to trade above key support levels such as 40317.3, it is likely to target higher resistance levels such as 43312.2 and may witness a breakout of this resistance if the bullish momentum continues.
Trading strategies based on Buy/Sell levels
| US30 | In case of buying | in case of selling |
| Entry point | 43211.9 | 42958.2 |
| Target Point 1 (TP1) | First resistance: 43338.7 | First support: 42859.6 |
| Target Point 2 (TP2) | Second resistance: 43410.0 | Second support: 24800.6 |
| Stop Loss (SL) | 42958.2 | 43211.9 |
The current technical outlook indicates that the Dow Jones index is continuing its upward trend, as the price is trading above the moving averages and the MACD indicator confirms the positive trend. The support level of 40317.3 remains the decisive factor in the continuation of the upward trend, as the index is expected to continue its gains as long as it remains above this level.


