
Dow Jones US30 Technical Analysis: The Dow Jones is trading in an uptrend today. The index recorded a high of 43,272 points and a low of 42,963 points, while the current price is 43,155 points.
Dow Jones US30 Technical Analysis: Price Analysis and Trading
Looking at the chart, we see that prices are trading above the moving averages, which reinforces the bullish trend. This indicates strong support for this trend.
Technical Indicators
The MACD indicator is showing strength in the positive direction, which reflects strong buying demand. These signals support optimism about the continuation of the bullish trend.
Trading Forecast for Today
If the index continues to trade above the moving averages, we may witness further rise towards new levels. Traders are advised to monitor the price action for any signs of a change in trend.
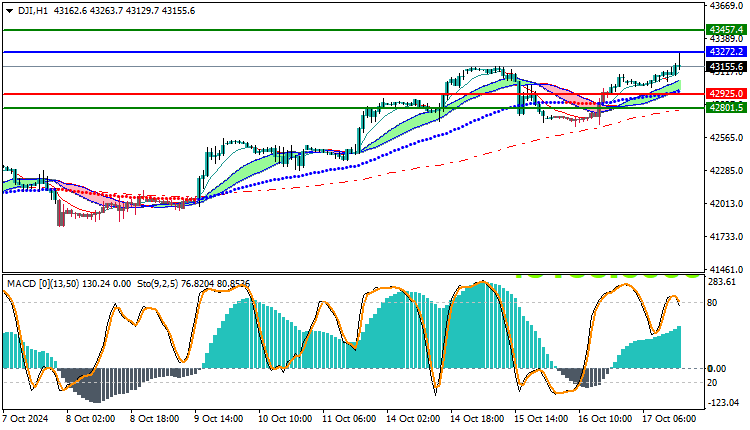
Trading strategies based on Buy/Sell levels
| US30 | In case of buying | in case of selling |
| Entry point | 43272 | 42925 |
| Target Point 1 (TP1) | First resistance: 43457 | First support: 42801 |
| Target Point 2 (TP2) | Second resistance: 43500 | Second support: 42760 |
| Stop Loss (SL) | 42925 | 43272 |
Based on the current analysis, traders are advised to take advantage of the uptrend while focusing on risk management strategies to ensure informed trading decisions.


