
Dow Jones US30 Technical Analysis: The Dow Jones is trading in a bearish trend today, as the index recorded its highest price so far at 43757.5 and the lowest price at 43518.4, and is currently trading at 43572.8.
Dow Jones US30 Technical Analysis :Technical Analysis
The current price action indicates that the index is trading below the moving averages, which reinforces expectations of a continuation of the downtrend. The MACD indicator is also showing negative divergence, which reflects the weakness of the bullish momentum and confirms the continuation of the negative trend.
Future Expectations:
If the index continues to trade below the moving averages, it is expected to continue the downtrend towards the upcoming support levels. Any signs of weakness in the negative trend should be followed, as they could indicate a bounce or correction in prices.
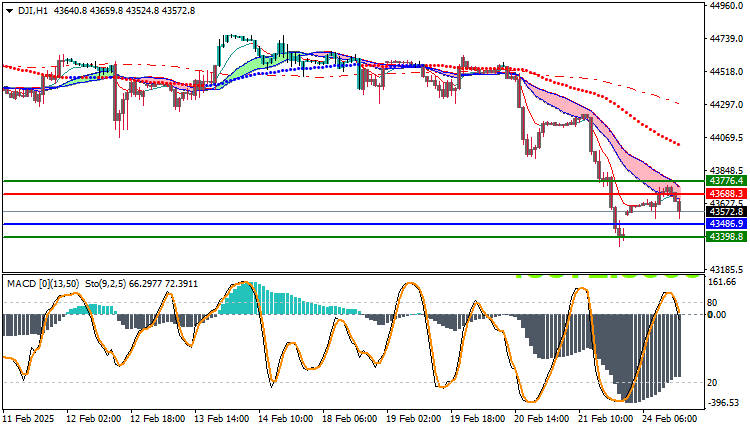
Trading strategies based on Buy/Sell levels
| US30 | In case of buying | in case of selling |
| Entry point | 43688.3 | 43486.9 |
| Target Point 1 (TP1) | First resistance: 43776.4 | First support: 43398.8 |
| Target Point 2 (TP2) | Second resistance: 43820.5 | Second support: 43342.7 |
| Stop Loss (SL) | 43486.9 | 43688.3 |
The overall trend of the Dow Jones remains bearish. It is essential to closely monitor technical indicators to identify potential opportunities or any changes in market momentum.


