
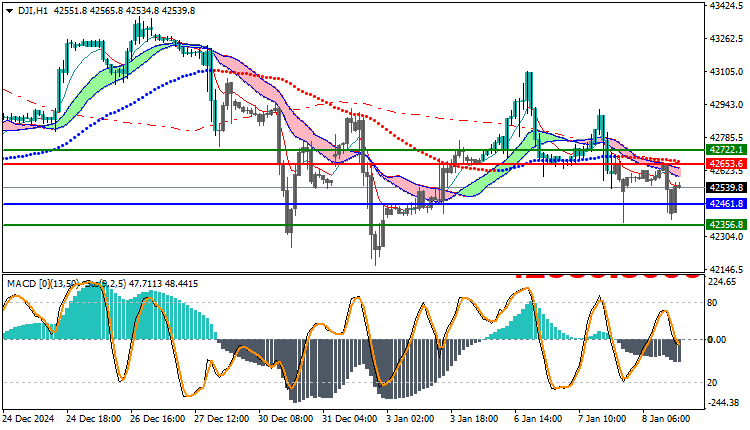
Dow Jones US30 Technical Analysis: The Dow Jones is trading in a bearish trend today, recording a high of 42653 in the current session and a low of 42388. Currently, the index is trading at 42539, reflecting the continued selling pressure in the market. Technical indicators indicate that the general trend of the index is leaning towards the downside, which supports expectations of continued negative pressure on prices.
Dow Jones US30 Technical Analysis: Trading Price Analysis
The Dow Jones index witnessed movements within a narrow range today, trading between a high of 42653 and a low of 42388. Currently, the index is trading at 42539, reflecting fluctuations near current levels, without any strong upward movement. This indicates that sellers may be controlling the market at the moment.
Technical Analysis:
- Moving Averages: The index is trading below the moving averages, reflecting a bearish trend. When the price trades below the moving averages, this indicates that the market is experiencing continuous selling pressure, which reinforces the continuation of the downward trend. This signal is considered negative in the general context of the market.
- MACD Indicator: The MACD indicator shows a negative trend, as the MACD line trades below the signal line, which reflects weak buying momentum and reinforces the downward trend. The gap between the two lines also indicates increasing selling pressure, which reinforces the hypothesis of a continued decline in prices in the near term.
Trading Expectations:
Based on the current technical analysis, the Dow Jones index is likely to continue its downward trend in the coming period, in light of trading below the moving averages and the negative signal from the MACD indicator. If the price continues to decline, the next support may be near 42350.
and if the index breaks this level, further declines may extend towards lower levels. However, in the event of an upward rebound, it needs to exceed the resistance of 42600 to change the trend.
Trading strategies based on Buy/Sell levels
| US30 | In case of buying | in case of selling |
| Entry point | 42653 | 42461 |
| Target Point 1 (TP1) | First resistance: 42722 | First support: 42356 |
| Target Point 2 (TP2) | Second resistance: 42790 | Second support: 42210 |
| Stop Loss (SL) | 42461 | 42653 |
Based on the current technical indicators, where the Dow Jones is trading below the moving averages and the MACD is showing negative signals, the downtrend of the index is likely to continue in the near term. It is advisable to follow the support and resistance levels at 42350 and 42600 to accurately determine the next moves.


