
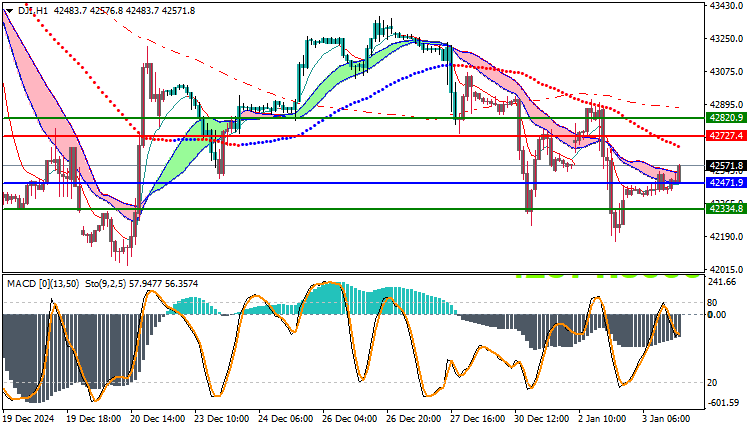
Dow Jones US30 Technical Analysis: The Dow Jones is trading in a bearish trend today, showing some weakness in the downward momentum. The index recorded a high of 42640 and a low of 42397, while it is currently trading near the 42571 level. This movement indicates limited volatility within a bearish range, with continued selling pressure despite some weakness in the downward momentum.
Dow Jones US30 Technical Analysis: Trading Price Analysis
Index prices continue to trade below the major moving averages, supporting the negative outlook and the downward trend. Trading below these averages reflects the dominance of selling forces in the market, as prices show a continuous decline without exceeding these averages, which reinforces the downward trend in the market.
Technical Analysis
Moving Averages: Trading below the moving averages reflects weakness in the upward momentum, and reinforces the negative outlook in general. Continued trading below these averages increases the possibility of continued downward pressure, as this is considered a strong technical signal that if there is no change in momentum, we may see further declines towards lower levels.
MACD Indicator: The MACD indicator is indicating a negative trend, as a negative crossover appears between the MACD line and the signal line, reflecting weak upward momentum and increasing selling pressure. Although the trend is still down, the indicator shows some weakness in this direction, which may indicate the possibility of short corrections or fluctuations in the movement, but in general, the negative outlook remains.
Today’s Future Outlook:
The downward trend is expected to continue in the coming hours, especially if the indicator continues to trade below the moving averages. The next support levels may be near 42397 or below.
while weak momentum may create some opportunities for fluctuations or corrections. However, the general outlook remains bearish as long as the indicator remains below the moving averages.
Trading strategies based on Buy/Sell levels
| US30 | In case of buying | in case of selling |
| Entry point | 42727 | 42471 |
| Target Point 1 (TP1) | First resistance: 42820 | First support: 42334 |
| Target Point 2 (TP2) | Second resistance: 42960 | Second support: 42210 |
| Stop Loss (SL) | 42471 | 42727 |
The Dow Jones remains bearish today, supported by prices trading below the moving averages and the MACD indicator indicating weak upward momentum. Despite some weakness in the downside, the overall outlook remains negative with a potential test of lower support levels in the near term.


