
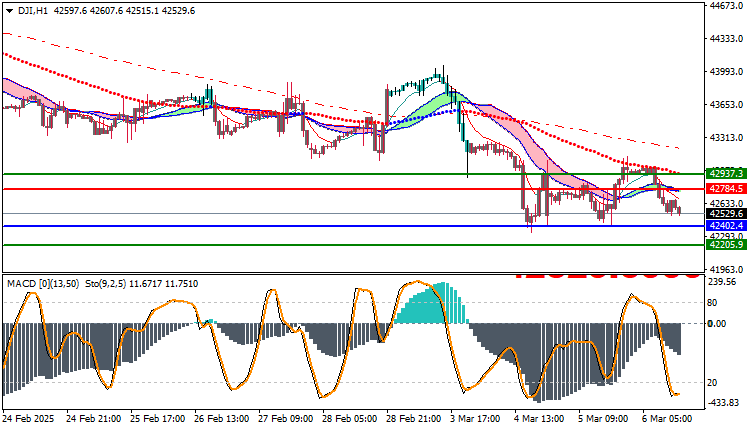
Dow Jones US30 Technical Analysis: Today, the Dow Jones is trading in a bearish trend, recording a high of 43013.8 and a low of 42500.7, while it is currently trading at 42529.6. Through technical analysis, we notice that prices are moving below the moving averages, which reinforces the bearish trend. The MACD indicator also indicates a negative trend, which reflects the weakness of the upward momentum and confirms the continuation of the downward trend.
Dow Jones US30 Technical Analysis: Technical Analysis
The index is trading below the moving averages, which indicates the strength of the downward trend. The MACD indicator also reflects a negative signal, which reinforces the idea that the market is currently favoring bearish movements. If trading continues below the moving averages, we may witness further declines towards lower support levels.
Trading Outlook:
The Dow Jones is expected to continue its downtrend in the short term as long as it continues to trade below the moving averages. If the selling pressure continues, we may see further declines towards strong support levels, which will be pivotal in determining the index’s direction in the near term.
Trading strategies based on Buy/Sell levels
| US30 | In case of buying | in case of selling |
| Entry point | 42529.6 | 42402.4 |
| Target Point 1 (TP1) | First resistance: 42937.3 | First support: 42205.9 |
| Target Point 2 (TP2) | Second resistance: 43105.4 | Second support: 42120.8 |
| Stop Loss (SL) | 42402.4 | 42529.6 |
Based on the current technical analysis, the Dow Jones appears to be on a downward trajectory supported by negative signals from the moving averages and the MACD. The index is expected to continue declining in the short term, with support and resistance levels to be carefully monitored to identify suitable trading opportunities.


