
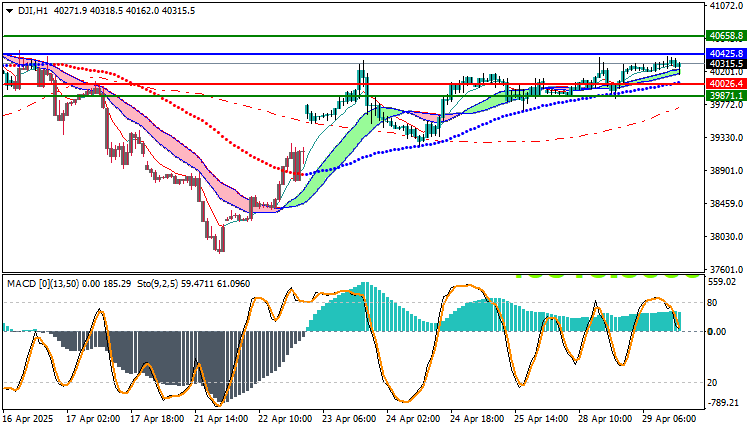
The Dow Jones Industrial Average has been moving in a steady ascending channel since its strong rebound from 39770 last week. Despite some slowdown in momentum, the index continues to trade above the technical support at 40064.4, gradually heading towards testing the crucial resistance at 40425.8, which represents a bottleneck in the next phase.
A Look at Price Action
- Current Price: 40315.5
- Near-term trend: Upward with consolidation
- Nearest resistance: 40425.8
- Near-term support: 40064.4
The index is showing relative strength and appears poised to confirm a breakout of critical technical resistance, which could push it to target new levels if the upward momentum is confirmed.
Dow Jones Industrial Average : Technical Analysis
Technical Indicators:
- MACD: Still in positive territory, but showing moderate oscillations, reflecting a wait-and-see phase.
- Stochastic: It moves between 60–65, i.e., in a neutral range with an upward bias, supporting the possibility of a continued positive movement.
Expected Scenarios Today
Bullish Scenario (Probable):
- If 40425.8 is breached with the closing of the H1 candle, the index will head towards the next resistance level, 40658.8.
Negative Scenario (Corrective):
- If the breakout fails and the price declines below 40064, we may witness a decline towards the support level, 39971, then 39770.
Trading strategies based on Buy/Sell levels
| US30 | In case of buying | in case of selling |
| Entry point | 40425.8 | 40026.4 |
| Target Point 1 (TP1) | First resistance: 40658.8 | First support: 39871.1 |
| Target Point 2 (TP2) | Second resistance: 40720.4 | Second support: 39800.3 |
| Stop Loss (SL) | 40026.4 | 40425.8 |
The Dow appears to be in a technically critical position, approaching a breakout above strong resistance. If confirmed, we could see a new upside wave. A decline below 40,064 would weaken the technical picture and could retest previous support levels.


