
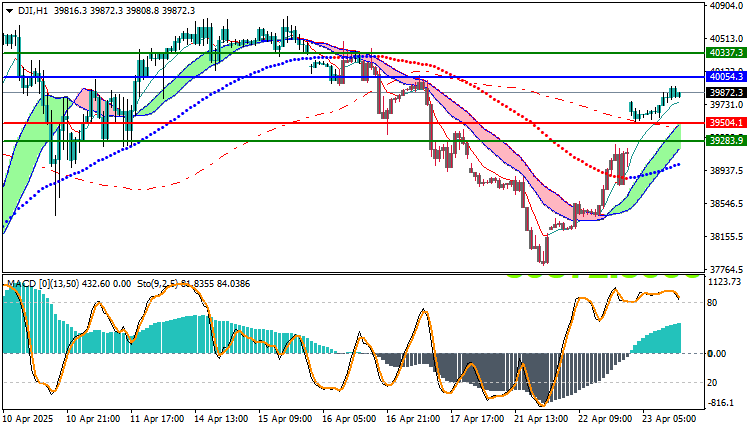
After a sharp decline that pushed the Dow Jones Index to levels near 39,200, the index rebounded strongly, crossing its moving averages once again, amid strong buying momentum and relative market optimism. The index is now approaching a significant resistance area, raising questions about its ability to continue its upward trend or return to a correction.
A Look at Price Action
- Current Price: 39,872.3
- Near-term trend: Strongly bullish
- Immediate highest resistance: 40,064.3
- Key support: 39,504.1
The price has successfully breached and stabilized above the resistance at 39,504, and is now moving towards a stubborn technical resistance level at 40,064. This level will determine the direction of the trend during today’s sessions.
Technical Analysis
Technical Indicators:
- MACD: Continuously bullish with strong positive momentum supporting the continued upward trend.
- Stochastic: In overbought areas (>84), which could lead to a short-term correction.
Expected Scenarios for Today
Bullish Scenario:
- A breakout of 40,064.3 opens the way for a target of 40,373.7 and then 40,500, supported by strong buying momentum.
Bearish Scenario:
- If the breakout fails and the price returns below 39,504, the index may decline to retest 39,263.9 and possibly 39,000.
Trading strategies based on Buy/Sell levels
| US30 | In case of buying | in case of selling |
| Entry point | 40054.3 | 39504.1 |
| Target Point 1 (TP1) | First resistance: 40337.3 | First support: 39283.9 |
| Target Point 2 (TP2) | Second resistance: 40621.4 | Second support: 39230.4 |
| Stop Loss (SL) | 39504.1 | 40054.3 |
The Dow Jones Industrial Average is showing a strong signal of a reversal from bearish to bullish after a technical rebound supported by technical indicators. However, as it approaches stubborn resistance, caution is advised and awaiting confirmed breakout signals before establishing new buying positions.


