
The Dow Jones Industrial Average (DJI) is showing remarkable consolidation after a strong upward wave, currently hovering near important technical resistance levels awaiting the next catalyst. With technical indicators crossing and the price stabilizing within a sideways range, the key question becomes: Is the index preparing for an upward price explosion or is a technical correction approaching?
Price Overview
- Current Price: 40247.9
- Previous Range: 40237-40338
- Near-Term Trend: Slightly Bearish Sideways
- Current High: 40849
- Key Immediate Support: 39766
The index is maintaining its trading above important dynamic support, after failing to break above 40849, reflecting strong resistance and clear hesitation between buyers and sellers.
Detailed Technical Analysis
General Trend:
- The general medium-term trend remains bullish, supported by the positive wave that began on April 9.
- However, in the short term, there is weak momentum, and a temporary technical correction is possible.
Technical Indicators:
- MACD: A negative crossover, but the candles remain above the zero line, indicating moderate momentum.
- Stochastic: Indicates an upward rebound from oversold areas, opening the way for a new upward attempt.
Today’s Impactful Economic Events
- Earnings from major US banks such as JPMorgan and Bank of America will strongly influence risk appetite.
- US retail sales data released today will provide clear signals about the health of the consumer economy.
- Expect the Federal Reserve Chairman’s remarks later today, which could move the markets strongly based on the expected tone of monetary policy.
Today’s Outlook – Trading Scenarios
Positive Scenario:
- If the index holds above 40,294 and successfully breaks 40,465, we may see an extension towards 40,849 again.
Negative scenario:
- A break of support at 39,766 will push the index towards 39,455 and possibly deepen the decline towards the 39,000 level in the event of selling pressure.
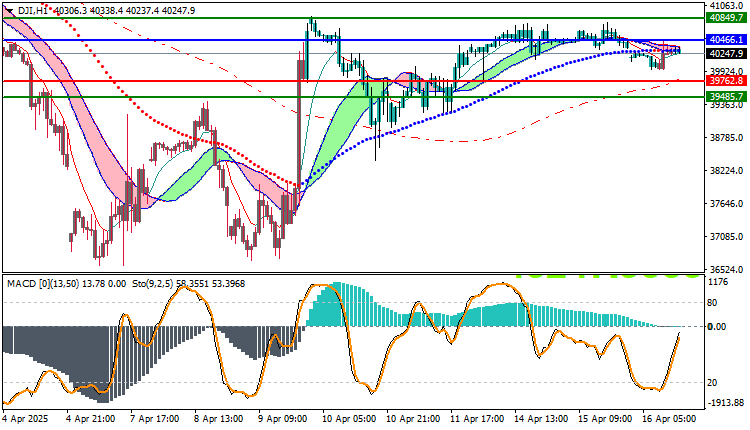
Trading strategies based on Buy/Sell levels
| US30 | In case of buying | in case of selling |
| Entry point | 40466.1 | 39762.8 |
| Target Point 1 (TP1) | First resistance: 40849.7 | First support: 39485.7 |
| Target Point 2 (TP2) | Second resistance: 40880.6 | Second support: 39285.2 |
| Stop Loss (SL) | 39762.8 | 40466.1 |
The Dow Jones Index is in a critical testing phase between continuing its upward trend or slipping into a new correction. Maintaining current support and bouncing off it may keep the positive scenario on the table, but smart traders must closely monitor economic data and adhere to confirmation signals from candlesticks and indicators.


