
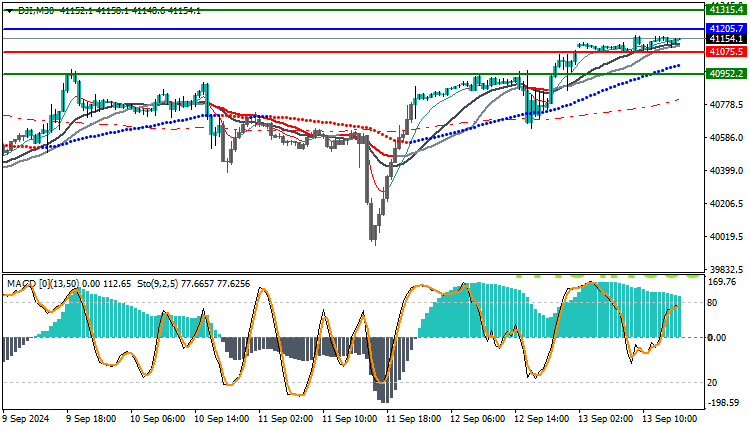
The Dow Jones 30 is trading in an uptrend today, with the price reaching $41,154. The index is showing positive movement as it is trading above most of the moving average crossovers, which supports the possibility of the uptrend continuing.
Moving Averages and Uptrend Support
The current moving averages show that the index is trading above them, which gives an indication of the stability of the market and the strength of the uptrend. This enhances traders’ confidence in the possibility of achieving further gains in the coming days.
MACD Indicator and Weakness Signals
Despite the uptrend, the MACD indicator is showing some negative signals indicating a weakness in the upward momentum. This signal may be a warning to traders to be cautious, as the index may witness a slight decline or fluctuations in the near term.
Dow Jones 30 Future Outlook
Based on the current technical analysis, the index is likely to continue its upward trend unless additional signs of weakness appear from technical indicators. Traders should monitor key technical levels and beware of any sudden market pullback.
Trading strategies based on Buy/Sell levels
| US30 | In case of buying | in case of selling |
| Entry point | 41205 | 41705 |
| Target Point 1 (TP1) | First resistance: 41315 | First support: 40952 |
| Target Point 2 (TP2) | Second resistance: 41410 | Second support: 40850 |
| Stop Loss (SL) | 41705 | 41205 |
The Dow Jones 30 is showing positive signs as it continues to trade above the moving averages, which enhances the chances of continuing the uptrend. However, attention should be paid to the signs of weakness shown by the MACD indicator, as it may indicate a decline in the upward momentum. Accordingly, traders are advised to follow market developments carefully and monitor important technical levels to ensure that informed decisions are made based on accurate data.


