
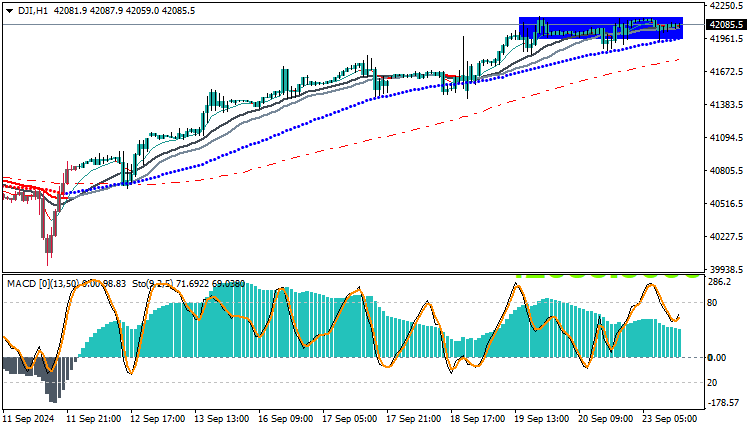
The Dow Jones 30 is trading today at $42,085, continuing its sideways movement between the support levels at 24,080 and the resistance levels at 41,950. Trading is taking place above the moving average crossovers, indicating that positive momentum is still present. However, the MACD indicator is showing some weakness in purchasing power, which may indicate a state of caution in the markets.
Dow Jones 30 Technical Analysis: Technical Outlook
On the current time frame, the Dow Jones 30 is still in a stable sideways movement between the indicated support and resistance levels. Although the price is holding above the moving average crossovers (such as the 50 and 100-period averages), this sideways movement may reflect a state of hesitation among investors, which limits the possibility of a strong breakout in either direction.
The weakness signals appearing from the MACD indicator indicate a slowdown in purchasing power, as the gap between the two lines has started to narrow. This could translate into a possible correction or a market entering a calm phase before taking a clear direction, whether downward or upward.
Trading strategies based on Buy/Sell levels
| US30 | In case of buying | in case of selling |
| Entry point | 42100 | 41950 |
| Target Point 1 (TP1) | First resistance: 42170 | First support: 41880 |
| Target Point 2 (TP2) | Second resistance: 42240 | Second support: 41810 |
| Stop Loss (SL) | 41950 | 42100 |
The Dow Jones 30 continues its sideways movement between the 24080 and 41950 areas, with signs of weakness in the buying momentum from the MACD indicator. Although the price continues to trade above the moving average crossovers, the sideways movement may continue for some time unless we see a clear break in either direction. Traders are advised to monitor the key support and resistance levels and follow the momentum indicators to identify upcoming trading opportunities.


