
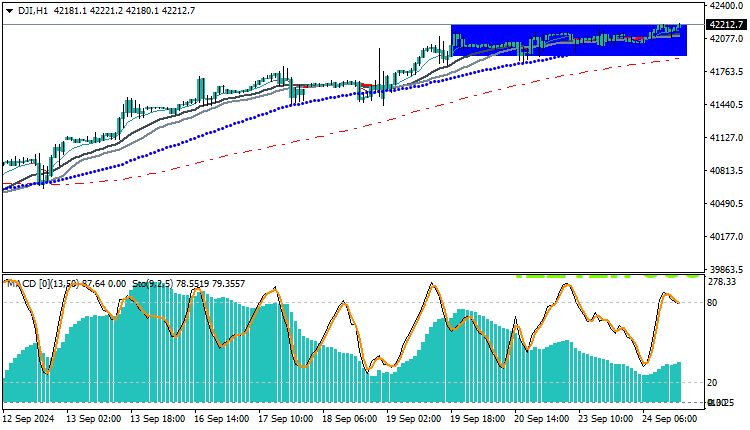
The Dow Jones 30 Index is trading today at $42,212, confined to a sideways range between 42,212 and 41,950. Despite the sideways movements, the index is trading above the moving averages’ crossovers.
which is a positive indicator reflecting the support of buyers. Also, the MACD indicator is providing strong buying signals that may enhance the chances of breaking the sideways trend upwards. In this analysis, we will take a look at the factors that may affect the index’s movement in the future.
Dow Jones 30 Technical Analysis: Technical Outlook
The index continues to move in a sideways range in the medium term.
as it finds strong support near the 24,080 level and resistance around 41,950.
Trading above the moving averages’ crossovers (50, 100, and 200 periods) indicates that the positive momentum is still present, despite the inability to break the resistance level so far.
MACD is showing a positive signal, as the MACD line is moving above the signal line in the positive zone, which reinforces the possibility of continued buying power. However, sideways movements remain in place in the absence of a clear breach of one of the main boundaries of the sideways range.
Indicators Expectations
- MACD: Indicates the presence of increasing buying power, which may push the market towards trying to test the resistance level at 41950 again.
- Moving Averages: The price continues to trade above the moving average crossovers, which reinforces the possibility of continued bullish momentum in the near term.
- Relative Strength Index (RSI): It is still moving in neutral areas, indicating the absence of an overbought or oversold condition, which allows room for further sideways or bullish movements.
Trading strategies based on Buy/Sell levels
| US30 | In case of buying | in case of selling |
| Entry point | 42212 | 41950 |
| Target Point 1 (TP1) | First resistance: 42300 | First support: 41880 |
| Target Point 2 (TP2) | Second resistance: 42380 | Second support: 41810 |
| Stop Loss (SL) | 41950 | 42212 |
Based on the current technical analysis, the Dow Jones 30 continues to move within a consolidation range between 42212 and 41950.With the MACD buying power signals, the index may witness an attempt to break through the resistance level in the coming sessions.Traders should carefully monitor the key support and resistance levels. and pay attention to any changes in momentum that may indicate a potential breakout of this range.


