
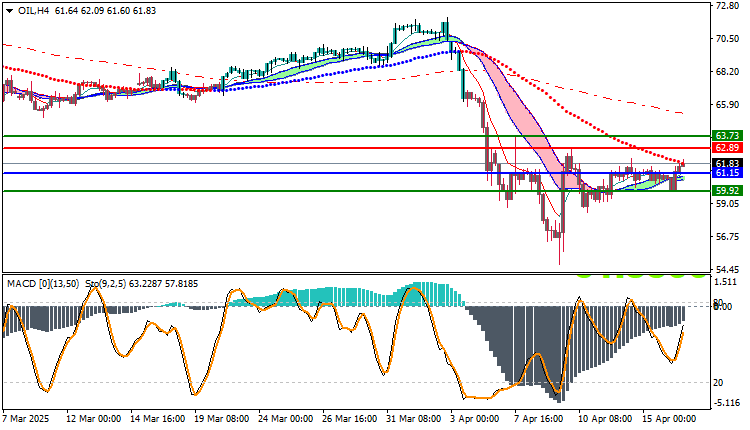
After a sharp decline in oil prices that took it below $60 per barrel, West Texas Intermediate (WTI) crude has begun showing signs of recovery, consolidating above the 59.92 support level and struggling to break through important technical resistance. Amid global market volatility and geopolitical pressures, oil prices face a real test in the coming trading sessions.
Market Overview and Trading Price
- Current Price: 61.83
- General Trend (H4): Bearish, with an attempt to break through resistance
- Key Support: 59.92
- Nearest Resistance: 62.89
Following the sharp decline in early April, crude began building a support base around 59.92 and, with some positive momentum, returned to test above the 61.83 level, which is considered an important price equilibrium point.
Professional Technical Analysis
Technical Indicators:
- MACD: Indicates a clear positive crossover, enhancing the possibility of an upward rebound.
- Stochastic: Moving in positive territory (above 50), without oversaturation, supporting the continuation of the current momentum.
Key Influencing Economic Factors
- Weekly US inventory data: Strongly impacts crude prices, and any unexpected decline supports the upward trend.
- Potential OPEC+ statements: Regarding production cuts or revising supply plans could reinforce the upward trend.
- US dollar movements: The inverse relationship with oil prices makes inflation data and monetary policy key factors.
Today’s Oil Forecast – Trading Scenarios
Positive Scenario:
- If the price maintains stability above 61.83 and succeeds in breaking 62.89, a rise towards 63.73 and then 65.00 is expected as a subsequent target.
Negative Scenario:
- If 61.15 and then 59.92 are broken, strong selling pressure will return, with a potential target of 58.00 and then 56.50.
Trading strategies based on Buy/Sell level
| USOIL | In case of buying | in case of selling |
| Entry point | 62.89 | 61.15 |
| Target Point 1 (TP1) | First resistance: 63.73 | First support: 59.92 |
| Target Point 2 (TP2) | Second resistance: 64.10 | Second support: 59.10 |
| Stop Loss (SL) | 61.15 | 62.89 |
Despite the general downtrend, technical recovery indicators are beginning to emerge, providing a speculative buying opportunity if resistance levels of 62.89 and 63.73 are breached. With influential US data awaited, the best scenario remains cautious until confirmation of the upcoming trend emerges.


