
Bitcoin (BTC) has experienced a strong push in recent hours, pushing it past important technical resistance levels, amid a wave of bullish momentum and positive sentiment in the crypto market. The hourly chart shows that buyers are beginning to take control, but the currency is now approaching psychological resistance levels that require a breakout confirmation.
Current Price and Market Trend
- Current Price: $87,194
- Overall Trend: Strongly bullish in the short term
- Technical Range: 85,200 – 88,200
- Momentum: Strong, but overbought signs are emerging
BTC/USD Technical Analysis
Overall Trend:
Bitcoin is on a short-term upward trajectory, after a strong breakout of the 86,000 and 85,200 resistance levels, recording a new high near 88,226. Technical Indicators:
- MACD: Strongly positive, momentum is at its highest levels, but divergence signals are beginning to appear.
- Stochastic Oscillator: In overbought areas, indicating an imminent price calming.
- Moving Averages: The price is above all moving averages (20, 50, and 200), supporting the positive trend.
Technical Outlook for Today
Buoyant Scenario:
If stability above 87,000 continues, we may witness a retest of 88,200 and possibly a breakout towards 89,000–90,000, provided momentum continues.
Between the two, the price may decline to test the support at 86,700 or even 85,200, forming a new baseline.
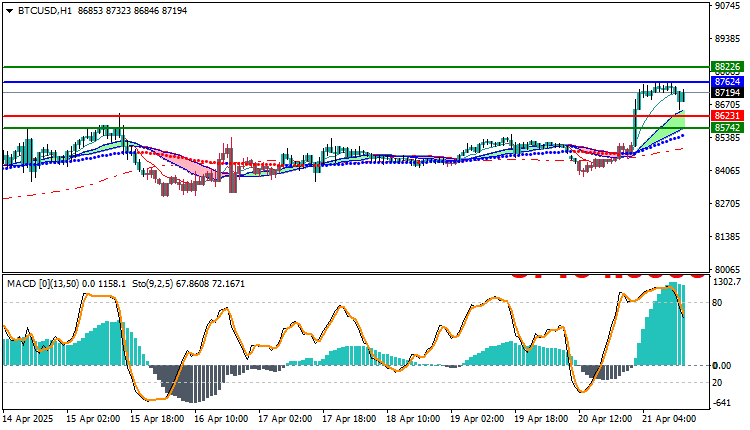
Trading strategies based on Buy/Sell levels
| BTCUSD | In case of buying | in case of selling |
| Entry point | 87624 | 86231 |
| Target Point 1 (TP1) | First resistance: 88226 | First support: 85742 |
| Target Point 2 (TP2) | Second resistance: 88751 | Second support: 85211 |
| Stop Loss (SL) | 86231 | 87624 |
Bitcoin appears poised to test new levels, but overbought conditions indicate a potential temporary technical correction. The overall trend remains positive, and any pullback is a buying opportunity as long as the price maintains support at 85,200.


