
Bitcoin (BTC) Technical Analysis: Bitcoin has seen a decline after a period of bullishness. The chart shows that the currency moved from its highest price so far at $57,800 to its lowest price at $56,051. The currency then witnessed a slight recovery, with the price currently trading at $56,426.
Bitcoin (BTC) Technical Analysis: Moving Average Indicators Analysis
- Price level compared to the averages: Prices are currently trading below the moving averages, indicating the continuation of the downtrend. This reflects that the selling pressure is still ongoing and that the overall trend is still bearish.
MACD Indicator Analysis:
- Trend signals: The MACD indicator shows the beginning of a negative trend, but it is still in its early stages. Despite the decline witnessed by the currency, the indicator indicates a weakness in the downward force, which may indicate a possible reversal in the near future.
Bitcoin (BTC) Technical Analysis: Buying and Selling Opportunities
- Selling Opportunities: The $57,800 levels can be considered as a major resistance level, where selling may continue if the price continues below this level. Watching for any signs of continued decline may provide additional selling opportunities.
- Buying Opportunities: In case of signs of improving buying power through additional indicators or a recovery in the MACD indicator, there may be an opportunity to buy at current support levels, especially if the price witnesses consolidation or recovery after the decline.
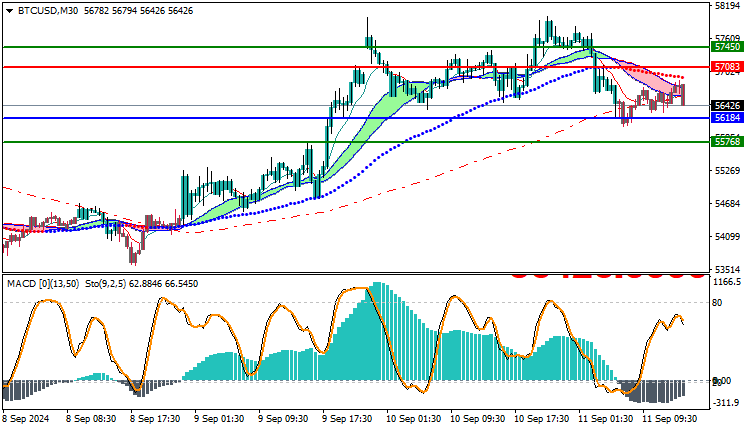
Trading strategies based on Buy/Sell levels
| BTCUSD | In case of buying | in case of selling |
| Entry point | 57083 | 56184 |
| Target Point 1 (TP1) | First resistance: 57450 | First support: 55768 |
| Target Point 2 (TP2) | Second resistance: 57500 | Second support: 55680 |
| Stop Loss (SL) | 56184 | 57083 |
Bitcoin continues its overall downtrend with prices trading below the moving averages. The MACD indicator indicates the beginning of a downtrend with a weakening downtrend, which requires close monitoring of market movements. It is important to follow any potential signs of a trend reversal or price recovery to determine appropriate intraday trading strategies.


