
The price of the digital currency Bitcoin is currently trading in a downtrend after a bullish period, as the price reaches $ 58,445. Bitcoin appears below most of the moving average crosses, indicating continued selling pressure. In addition, the MACD indicator shows clear signs of bearish strength, which supports the continuation of the downtrend and confirms the continuation of selling.
Moving Averages
The price of Bitcoin is trading below most of the moving average crosses, indicating the presence of selling pressure. When the price is below the moving averages, this often indicates the strength of the downtrend. Moving averages provide a dynamic resistance level, and when the price is below them, they act as a barrier that enhances the continuation of the downtrend.
MACD Indicator
The MACD indicator indicates the presence of bearish strength, which supports the continuation of the downtrend. When the MACD line is below the signal line, and the range (Histogram) is in the negative area, this indicates that the selling pressure is strong and supports the continuation of the decline. These signals confirm that the downtrend of Bitcoin may continue, and reinforce the selling strategies in the market.
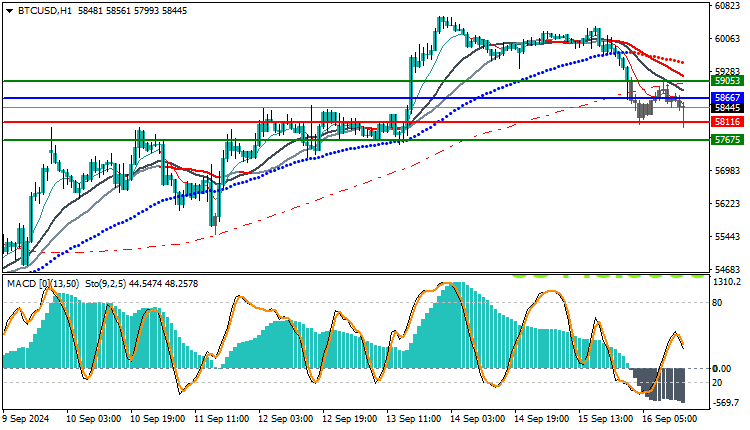
Trading strategies based on Buy/Sell levels
| BTCUSD | In case of buying | in case of selling |
| Entry point | 58667 | 58116 |
| Target Point 1 (TP1) | First resistance: 59053 | First support: 57675 |
| Target Point 2 (TP2) | Second resistance: 59150 | Second support: 57580 |
| Stop Loss (SL) | 57686 | 58104 |
Technical indicators indicate that the downtrend of Bitcoin may continue in the coming period, with confirmation from the MACD indicator and the price being below the moving averages. Current trading supports the continuation of selling while monitoring any signals that may change the price movement. Based on the analysis of the moving averages and the MACD indicator, the price of Bitcoin appears to be in a state of weakness, with the downtrend confirmed by the price crossing below the moving averages and the bearish strength reflected by the MACD indicator. It is advisable to monitor any changes in these indicators that may indicate an opportunity for a change in trend or new volatility.


