
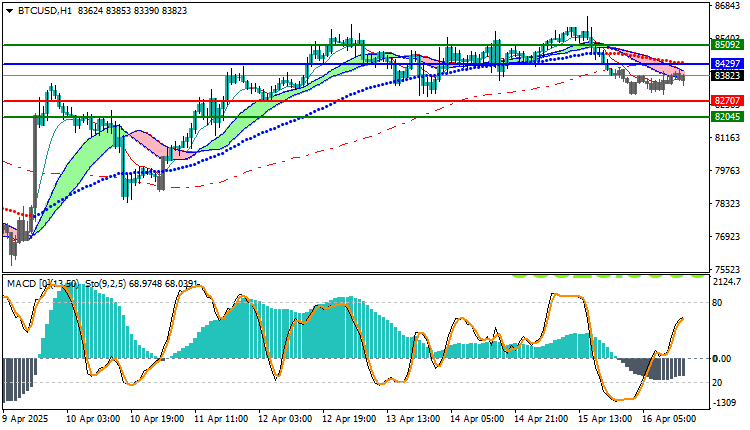
After strong breakouts last week, Bitcoin, the world’s largest cryptocurrency, has returned to trading within a narrow descending channel in the short term, reflecting potential selling pressure. As the market awaits US economic data and new statements from the Federal Reserve, markets are closely monitoring the trajectory of the most popular cryptocurrency. In this analysis, we review the recent movements of BTC/USD, highlighting the most prominent technical levels and today’s forecasts.
A Look at the Current Price and Trend
- Current price: $83,823
- Short-term trend: Bearish within a descending channel
- General trend: Upward in the medium term
- Near-term resistance: 84,297
- Near-term support: 82,707
The currency witnessed a temporary technical break of the 84,297 level, entering a bearish sideways range. However, the price remains consolidated above the long-term moving averages, indicating a continued upward trend in the medium term despite the current correction. Full Technical Analysis
Technical Indicators:
- MACD: Indicates a slowdown in negative momentum, with a possible positive crossover soon.
- Stochastic: Has exited the oversold zone and is trending upward, signaling a potential start to a bullish rebound.
Economic Events Affecting Bitcoin’s Movement Today
- US Retail Sales Data: Affects risk appetite in the markets, which directly impacts the performance of cryptocurrencies.
- Expected Statements from US Federal Reserve Members: Any hints of monetary tightening or interest rate hikes could strengthen the dollar and pressure Bitcoin.
- Continued anxiety in US stock markets:
Some traders are pushing Bitcoin to use it as a hedge, while others prefer liquidation.
Today’s Outlook – Trading Scenarios
Business Scenario (Bullish Breakout):
- If the price successfully breaks 84,297 and stabilizes above it, we may witness a rise towards 85,092 and possibly higher if strong buying momentum returns.
Negative scenario (continued decline):
- If the price breaks the support level of 82,707, it is expected to head towards 82,045, with a potential target of 81,500 if selling pressure increases.
Trading strategies based on Buy/Sell levels
| BTCUSD | In case of buying | in case of selling |
| Entry point | 84297 | 82707 |
| Target Point 1 (TP1) | First resistance: 85092 | First support: 82045 |
| Target Point 2 (TP2) | Second resistance: 85410 | Second support: 82010 |
| Stop Loss (SL) | 82707 | 84297 |
Bitcoin is currently in a delicate testing phase, with technical selling pressure and rebound attempts supported by momentum indicators. Holding above 82,707 maintains the upside potential, but a loss of this level could send the market back to lower levels. In light of the upcoming economic events, traders should monitor breakout levels and use stop-loss strategies with caution.


